Extension jQuery EasyUI -Vue DataGrid
 Extension jQuery EasyUI
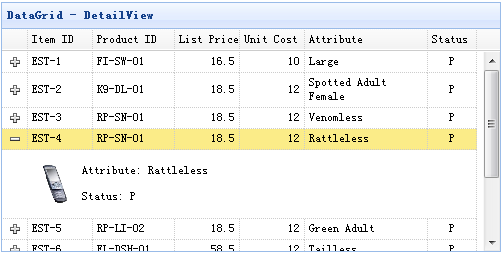
Vue détaillée DataGrid
Utilisation
Étape 1 : Créer une page HTML
    <head>
        <script type="text/javascript" src="datagrid-detailview.js.html"></script>
    </head>
    <body>
        <table id="tt"></table>
    </body>
Étape 2 : Créer un DataGrid
    $('#tt').datagrid({
        title:'DataGrid - DetailView',
        width:500,
        height:250,
        remoteSort:false,
        singleSelect:true,
        nowrap:false,
        fitColumns:true,
        url:'datagrid_data.json',
        columns:[[
            {field:'itemid',title:'Item ID',width:80},
            {field:'productid',title:'Product ID',width:100,sortable:true},
            {field:'listprice',title:'List Price',width:80,align:'right',sortable:true},
            {field:'unitcost',title:'Unit Cost',width:80,align:'right',sortable:true},
            {field:'attr1',title:'Attribute',width:150,sortable:true},
            {field:'status',title:'Status',width:60,align:'center'}
        ]],
        view: detailview,
        detailFormatter: function(rowIndex, rowData){
            return '<table><tr>' +
                    '<td rowspan=2 style="border:0"><img src="images/index.html' + rowData.itemid + '.png" style="height:50px;"></td>' +
                    '<td style="border:0">' +
                    '<p>Attribute: ' + rowData.attr1 + '</p>' +
                    '<p>Status: ' + rowData.status + '</p>' +
                    '</td>' +
                    '</tr></table>';
        }
    });
Propriétés
| Name |
Type |
Description |
Valeur par défaut |
| detailFormatter |
function(index,row) |
Une fonction de formatage qui renvoie le contenu détaillé d'une ligne. |
|
Événements
| Name |
Parameters |
Description |
| onExpandRow |
index,row |
Déclenché lorsqu'une ligne est développée. |
| onCollapseRow |
index,row |
Déclenché lorsqu'une ligne est réduite. |
Méthodes
| Name |
Parameters |
Description |
| fixDetailRowHeight |
index |
Fixe la hauteur de la ligne de détail. |
| getExpander |
index |
Récupère l'objet d'expansion de ligne. |
| getRowDetail |
index |
Obtenir le conteneur de détail de la ligne. |
| expandRow |
index |
Développer une ligne. |
| collapseRow |
index |
Réduire une ligne. |
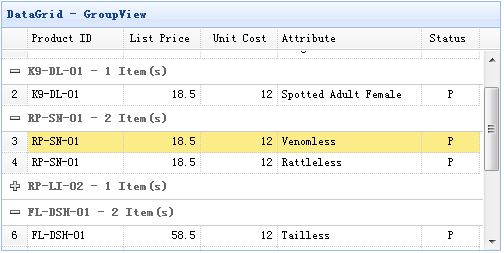
DataGrid GroupView
Utilisation
Étape 1 : Créer une page HTML
    <head>
        <script type="text/javascript" src="datagrid-groupview.js.html"></script>
    </head>
    <body>
        <table id="tt"></table>
    </body>
Étape 2 : Créer un DataGrid
    $('#tt').datagrid({
        title:'DataGrid - GroupView',
        width:500,
        height:250,
        rownumbers:true,
        remoteSort:false,
        nowrap:false,
        fitColumns:true,
        url:'datagrid_data.json',
        columns:[[
            {field:'productid',title:'Product ID',width:100,sortable:true},
            {field:'listprice',title:'List Price',width:80,align:'right',sortable:true},
            {field:'unitcost',title:'Unit Cost',width:80,align:'right',sortable:true},
            {field:'attr1',title:'Attribute',width:150,sortable:true},
            {field:'status',title:'Status',width:60,align:'center'}
        ]],
        groupField:'productid',
        view: groupview,
        groupFormatter:function(value, rows){
            return value + ' - ' + rows.length + ' Item(s)';
        }
    });
Propriétés
| Name |
Type |
Description |
Default |
| groupField |
string |
Indique le champ à regrouper. |
|
| groupFormatter |
function(value,rows) |
Une fonction de formatage qui renvoie le contenu du groupe.
Le paramètre value indique la valeur du groupe définie par la propriété 'groupField'.
Le paramètre rows indique les lignes de données en fonction de la valeur de groupe spécifiée. |
|
Méthodes
| Name |
Parameters |
Description |
| expandGroup |
groupIndex |
Développer un groupe. |
| collapseGroup |
groupIndex |
Réduire un groupe. |
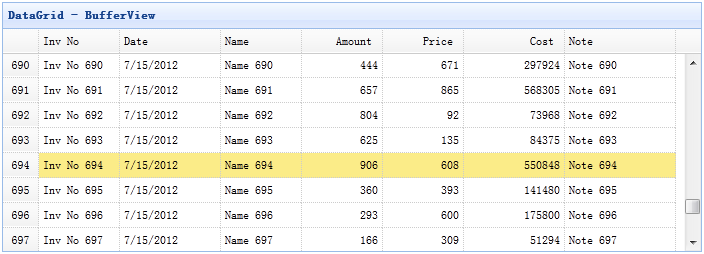
DataGrid BufferView
Étape 1 : inclure le fichier 'datagrid-bufferview.js'
    <head>
        <script type="text/javascript" src="datagrid-bufferview.js.html"></script>
    </head>
Étape 2 : Créer un DataGrid
    <table id="tt" class="easyui-datagrid" style="width:700px;height:250px"
            title="DataGrid - BufferView"
            data-options="url:'get_data.php',view:bufferview,rownumbers:true,singleSelect:true,autoRowHeight:false,pageSize:50">
        <thead>
            <tr>
                <th field="inv" width="80">Inv No</th>
                <th field="date" width="100">Date</th>
                <th field="name" width="80">Name</th>
                <th field="amount" width="80" align="right">Amount</th>
                <th field="price" width="80" align="right">Price</th>
                <th field="cost" width="100" align="right">Cost</th>
                <th field="note" width="110">Note</th>
            </tr>
        </thead>
    </table>
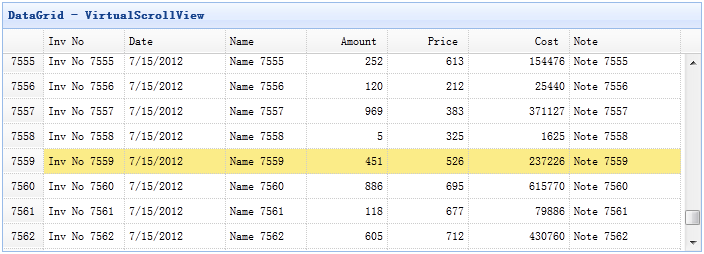
DataGrid VirtualScrollView
Étape 1 : inclure le fichier 'datagrid-scrollview.js'
    <head>
        <script type="text/javascript" src="datagrid-scrollview.js.html"></script>
    </head>
Étape 2 : créer un DataGrid avec la vue de défilement virtuelle
    <table id="tt" class="easyui-datagrid" style="width:700px;height:250px"
            title="DataGrid - VirtualScrollView"
            data-options="url:'get_data.php',view:scrollview,rownumbers:true,singleSelect:true,autoRowHeight:false,pageSize:50">
        <thead>
            <tr>
                <th field="inv" width="80">Inv No</th>
                <th field="date" width="100">Date</th>
                <th field="name" width="80">Name</th>
                <th field="amount" width="80" align="right">Amount</th>
                <th field="price" width="80" align="right">Price</th>
                <th field="cost" width="100" align="right">Cost</th>
                <th field="note" width="110">Note</th>
            </tr>
        </thead>
    </table>
Télécharger les exemples jQuery EasyUI
jquery-easyui-datagridview.zip
Extension jQuery EasyUI Autres extensions