jQuery EasyUI 拡張 -データグリッドビュー(DataGrid View)
 jQuery EasyUI 拡張
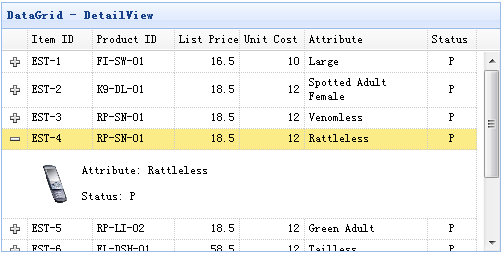
データグリッド詳細ビュー(DataGrid DetailView)
使い方
ステップ1:HTMLページを作成する
    <head>
        <script type="text/javascript" src="datagrid-detailview.js.html"></script>
    </head>
    <body>
        <table id="tt"></table>
    </body>
ステップ2:データグリッド(DataGrid)を作成する
    $('#tt').datagrid({
        title:'DataGrid - DetailView',
        width:500,
        height:250,
        remoteSort:false,
        singleSelect:true,
        nowrap:false,
        fitColumns:true,
        url:'datagrid_data.json',
        columns:[[
            {field:'itemid',title:'Item ID',width:80},
            {field:'productid',title:'Product ID',width:100,sortable:true},
            {field:'listprice',title:'List Price',width:80,align:'right',sortable:true},
            {field:'unitcost',title:'Unit Cost',width:80,align:'right',sortable:true},
            {field:'attr1',title:'Attribute',width:150,sortable:true},
            {field:'status',title:'Status',width:60,align:'center'}
        ]],
        view: detailview,
        detailFormatter: function(rowIndex, rowData){
            return '<table><tr>' +
                    '<td rowspan=2 style="border:0"><img src="images/index.html' + rowData.itemid + '.png" style="height:50px;"></td>' +
                    '<td style="border:0">' +
                    '<p>Attribute: ' + rowData.attr1 + '</p>' +
                    '<p>Status: ' + rowData.status + '</p>' +
                    '</td>' +
                    '</tr></table>';
        }
    });
プロパティ
| 名前 |
型 |
説明 |
デフォルト値 |
| detailFormatter |
function(index,row) |
行の詳細内容を返すフォーマット関数。 |
|
イベント
| 名前 |
パラメータ |
説明 |
| onExpandRow |
index,row |
行を展開したときに発生します。 |
| onCollapseRow |
index,row |
行を折りたたんだときに発生します。 |
メソッド
| 名前 |
パラメータ |
説明 |
| fixDetailRowHeight |
index |
詳細行の高さを固定します。 |
| getExpander |
index |
行の拡張オブジェクトを取得します。 |
| getRowDetail |
index |
行の詳細コンテナを取得します。 |
| expandRow |
index |
行を展開します。 |
| collapseRow |
index |
行を折りたたみます。 |
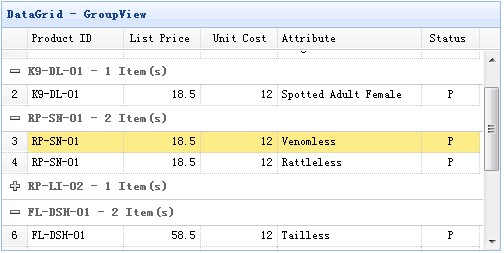
データグリッドグループビュー(DataGrid GroupView)
使い方
ステップ1:HTMLページを作成する
    <head>
        <script type="text/javascript" src="datagrid-groupview.js.html"></script>
    </head>
    <body>
        <table id="tt"></table>
    </body>
ステップ2:データグリッド(DataGrid)を作成する
    $('#tt').datagrid({
        title:'DataGrid - GroupView',
        width:500,
        height:250,
        rownumbers:true,
        remoteSort:false,
        nowrap:false,
        fitColumns:true,
        url:'datagrid_data.json',
        columns:[[
            {field:'productid',title:'Product ID',width:100,sortable:true},
            {field:'listprice',title:'List Price',width:80,align:'right',sortable:true},
            {field:'unitcost',title:'Unit Cost',width:80,align:'right',sortable:true},
            {field:'attr1',title:'Attribute',width:150,sortable:true},
            {field:'status',title:'Status',width:60,align:'center'}
        ]],
        groupField:'productid',
        view: groupview,
        groupFormatter:function(value, rows){
            return value + ' - ' + rows.length + ' Item(s)';
        }
    });
プロパティ
| 名前 |
型 |
説明 |
デフォルト |
| groupField |
string |
グループ化するフィールドを指定します。 |
|
| groupFormatter |
function(value,rows) |
グループ化された内容を返すフォーマット関数。
value パラメータは、'groupField' プロパティで定義されたグループ値を示します。
rows パラメータは、指定されたグループ値に基づいてデータ行を示します。 |
|
メソッド
| 名前 |
パラメータ |
説明 |
| expandGroup |
groupIndex |
グループを展開します。 |
| collapseGroup |
groupIndex |
グループを折りたたみます。 |
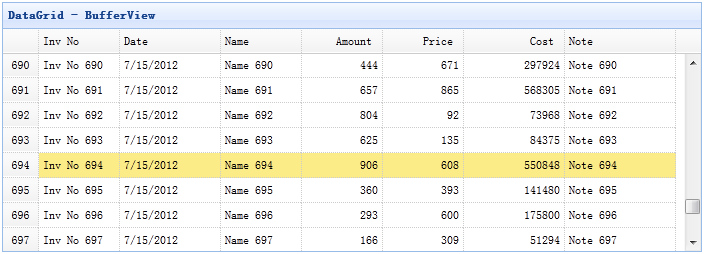
データグリッドバッファビュー(DataGrid BufferView)
ステップ1:'datagrid-bufferview.js' ファイルをインクルードします。
    <head>
        <script type="text/javascript" src="datagrid-bufferview.js.html"></script>
    </head>
ステップ2:データグリッド(DataGrid)を作成する
    <table id="tt" class="easyui-datagrid" style="width:700px;height:250px"
            title="DataGrid - BufferView"
            data-options="url:'get_data.php',view:bufferview,rownumbers:true,singleSelect:true,autoRowHeight:false,pageSize:50">
        <thead>
            <tr>
                <th field="inv" width="80">Inv No</th>
                <th field="date" width="100">Date</th>
                <th field="name" width="80">Name</th>
                <th field="amount" width="80" align="right">Amount</th>
                <th field="price" width="80" align="right">Price</th>
                <th field="cost" width="100" align="right">Cost</th>
                <th field="note" width="110">Note</th>
            </tr>
        </thead>
    </table>
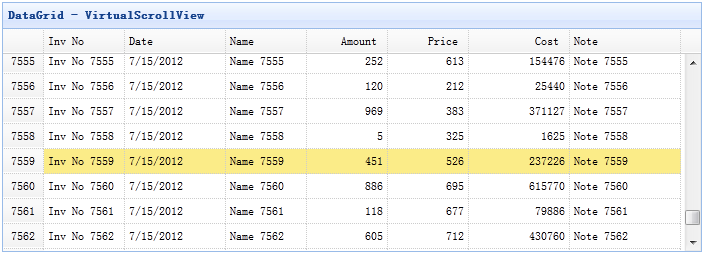
データグリッド仮想スクロールビュー(DataGrid VirtualScrollView)
ステップ1:'datagrid-scrollview.js' ファイルをインクルードします。
    <head>
        <script type="text/javascript" src="datagrid-scrollview.js.html"></script>
    </head>
ステップ2:仮想スクロールビューを使用してデータグリッド(DataGrid)を作成します。
    <table id="tt" class="easyui-datagrid" style="width:700px;height:250px"
            title="DataGrid - VirtualScrollView"
            data-options="url:'get_data.php',view:scrollview,rownumbers:true,singleSelect:true,autoRowHeight:false,pageSize:50">
        <thead>
            <tr>
                <th field="inv" width="80">Inv No</th>
                <th field="date" width="100">Date</th>
                <th field="name" width="80">Name</th>
                <th field="amount" width="80" align="right">Amount</th>
                <th field="price" width="80" align="right">Price</th>
                <th field="cost" width="100" align="right">Cost</th>
                <th field="note" width="110">Note</th>
            </tr>
        </thead>
    </table>
jQuery EasyUI サンプルをダウンロード
jquery-easyui-datagridview.zip
jQuery EasyUI 拡張 その他の拡張